Artikel
Zeitreihendatenbanken: Verwalten von Daten, die sich im Laufe der Zeit ändern
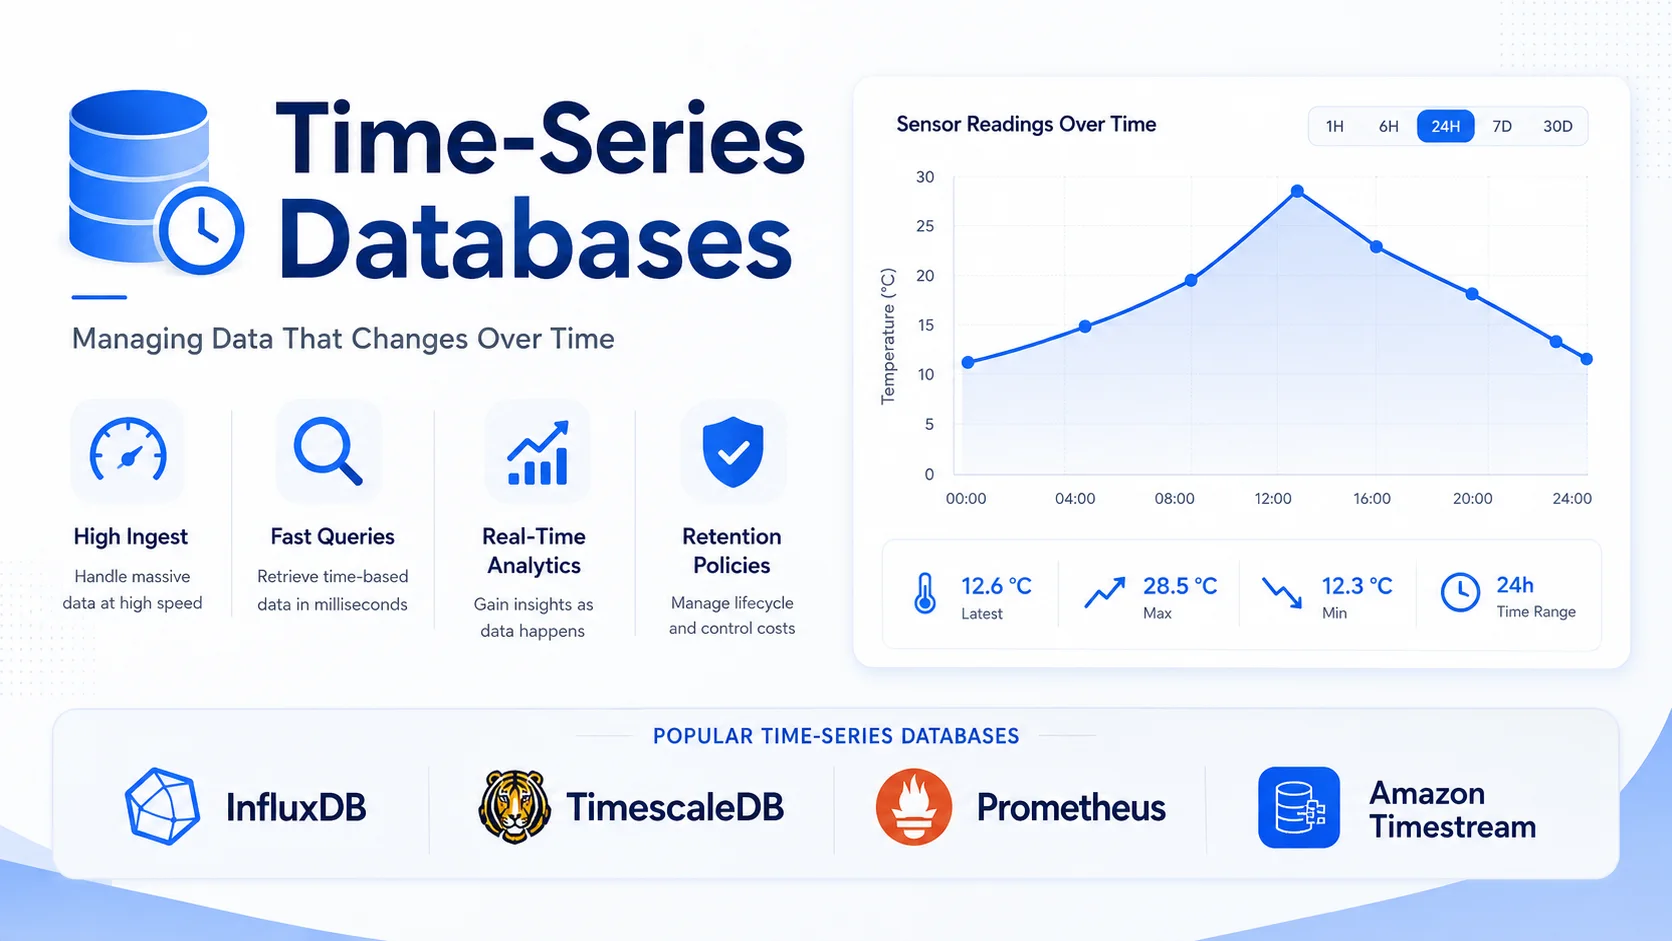
Eine Zeitreihendatenbank (TSDB) ist auf die Speicherung und Abfrage von zeitindizierten Datenpunkten spezialisiert – Sensormesswerte, Servermetriken, Anwendungsprotokolle, Finanz-Tick-Daten und IoT-Telemetrie. Zeitreihendaten weisen einzigartige Eigenschaften auf, die herkömmliche Datenbanken suboptimal machen:
3 Min. LesezeitSprache: DE DeutschKostenlos0 Claps0 Kommentare
TechnologieEngineering-ArtikelTimeDatabasesTechnologyEngineering ArticlesSeries
Leseoptionen
Einführung
Eine Zeitreihendatenbank (TSDB) ist auf die Speicherung und Abfrage von zeitindizierten Datenpunkten spezialisiert – Sensormesswerte, Servermetriken, Anwendungsprotokolle, Finanz-Tick-Daten und IoT-Telemetrie. Zeitreihendaten weisen einzigartige Eigenschaften auf, die herkömmliche Datenbanken suboptimal machen:
- Schreiblastig – Millionen bis Milliarden Datenpunkte pro Tag.
- Nur anhängen – Daten werden selten aktualisiert, fast immer angehängt.
- Zeitlich geordnet – Abfragen umfassen immer einen Zeitbereich.
- Aufbewahrungsbasiert – Alte Daten werden schließlich zusammengefasst oder gelöscht.
- Downsampling – Ältere Daten werden mit niedrigerer Auflösung gespeichert.
Eigenschaften von Zeitreihendaten
Das Datenmodell
Jeder Zeitreihendatenpunkt hat:
| Komponente | Beispiel | Beschreibung |
|---|---|---|
| Zeitstempel | 24.05.2026T14:30:00Z | Als die Messung durchgeführt wurde |
| Wert | 42.5 | Der gemessene Wert |
| Metrik | cpu_usage | Was wird gemessen? |
| Tags/Labels | host=web01, Region=us-east | Metadaten zum Filtern |
Metric: cpu_usage{host="web01", region="us-east"}
┌─────────────────────┬───────┐
│ Timestamp           │ Value │
├─────────────────────┼───────┤
│ 2026-05-24T14:30:00 │ 42.5  │
│ 2026-05-24T14:30:01 │ 43.2  │
│ 2026-05-24T14:30:02 │ 41.8  │
│ ...                 │ ...   │
└─────────────────────┴───────┘
Zeitreihen vs. traditionelle Datenbanken
| Betrieb | PostgreSQL | TimescaleDB (PostgreSQL + TS) | InfluxDB (TSDB) |
|---|---|---|---|
| Schreibdurchsatz | 10.000 Zeilen/Sek | 100.000–1 Mio. Zeilen/Sek | 1M+ Zeilen/Sek |
| Abfrage: Durchschnittlich 1 Stunde mal 5 Minuten | Minuten (vollständiger Scan) | Sekunden (kontinuierliche Aggregation) | Sekunden |
| Speicher | Zeilenorientiert | Hybride Zeile/Spalte | Spaltenorientiert |
| Komprimierung | Standardmäßig keine | 90 %+ (native Komprimierung) | 90%+ |
| Aufbewahrungsrichtlinien | Manuelle Partitionsverwaltung | Automatisch | Automatisch |
| Daten-Downsampling | Manuelle Abfragen | Kontinuierliche Aggregate | Downsampling-Abfragen |
| SQL-Unterstützung | Voll | Vollständig (SQL) | Begrenzt (Flux/SQL) |
Zeitreihen-Datenbankvergleich
| Funktion | TimescaleDB | InfluxDB | Prometheus | VictoriaMetrics | QuestDB |
|---|---|---|---|---|---|
| Motor | PostgreSQL-Erweiterung | Benutzerdefinierte TS-Engine | Benutzerdefinierte Pull-basierte | Benutzerdefinierte TS-Engine | Säulenförmig |
| Abfragesprache | SQL | SQL/Flux | PromQL | PromQL-kompatibel | SQL + Zufluss |
| Aufnahmerate | 1M+/Sek | 1M+/Sek | 500K/Sek | 1M+/Sek | 2M+/Sek |
| Komprimierung | 90-97 % | 90+% | Keine | 90+% | 90+% |
| Clusterbildung | Multi-Knoten (timescaledb) | Unternehmen | Natives Sharding | Einheimisch | Keine |
| Aufbewahrung | Automatisch mit Richtlinien | Automatisch | Konfigurierbar | Konfigurierbar | Handbuch |
| Kontinuierliche Aggregate | Ja (nativ) | Nein (separate Aufgabe) | Aufnahmeregeln | Aufnahmeregeln | Nein |
| Am besten für | SQL-Benutzer, Betriebsdaten | IoT, DevOps | Kubernetes, Cloud Native | Hochwertige Metriken | Finanziell, schnell |
InfluxDB: Die dedizierte TSDB
Datenmodell
# InfluxDB v3 — data model
from influxdb_client import InfluxDBClient, Point
from influxdb_client.client.write_api import SYNCHRONOUS

client = InfluxDBClient(url="http://localhost:8086", token="my-token")
write_api = client.write_api(write_options=SYNCHRONOUS)

# A point = measurement + tags + fields + timestamp
point = (
    Point("temperature")
    .tag("sensor", "sensor-001")
    .tag("location", "warehouse-a")
    .field("value", 23.5)
    .field("humidity", 65.2)
    .time(datetime.utcnow())
)

write_api.write(bucket="sensors", record=point)
Abfragen
-- InfluxDB SQL (v3)
SELECT time, value
FROM temperature
WHERE sensor = 'sensor-001'
  AND time >= NOW() - INTERVAL '1 hour'
ORDER BY time DESC;

-- Aggregation with downsampling
SELECT time_bucket(INTERVAL '5 minutes', time) as bucket,
       AVG(value) as avg_temp,
       MAX(value) as max_temp,
       MIN(value) as min_temp
FROM temperature
WHERE location = 'warehouse-a'
  AND time >= NOW() - INTERVAL '24 hours'
GROUP BY bucket
ORDER BY bucket;
Aufbewahrungsrichtlinien
-- InfluxDB: automatic data lifecycle
CREATE RETENTION POLICY "one_hour"
ON "sensors"
DURATION 1h
REPLICATION 1
DEFAULT;

CREATE RETENTION POLICY "one_week"
ON "sensors"
DURATION 168h
REPLICATION 1;

-- Create downsample task
CREATE TASK "downsample_1h" ON "sensors"
  EVERY 1 HOUR
  BEGIN
    -- Aggregate 1-minute data to 1-hour averages
    SELECT time_bucket(INTERVAL '1 hour', time) as time,
           AVG(value) as value
    INTO "one_week"."temperature_hourly"
    FROM "one_hour"."temperature"
    WHERE time >= NOW() - INTERVAL '2 hours'
    GROUP BY 1, sensor, location;
  END;
Prometheus: Cloud-native Überwachung
Architektur (Pull-Modell)
┌─────────────────────────────────────────────────┐
│              Prometheus Server                   │
│  ┌──────────┐  ┌──────────┐  ┌───────────────┐  │
│  │ Retrieval│  │ TSDB     │  │ Alertmanager  │  │
│  │ (pull)   │──│ (storage)│──│ (alerts)      │  │
│  └─────┬────┘  └──────────┘  └───────────────┘  │
│        │                                          │
└────────┼──────────────────────────────────────────┘
         │
    ┌────┼────────────┬──────────────┐
    ▼    ▼            ▼              ▼
  App  App   Node Exporter   Custom Exporter
PromQL (Prometheus-Abfragesprache)
# Basic queries
cpu_usage{host="web01"}
http_requests_total[5m]

# Rate (per-second average)
rate(http_requests_total[5m])

# Aggregation
avg by (host) (cpu_usage)

# Histogram quantile
histogram_quantile(0.95, rate(http_request_duration_seconds_bucket[5m]))

# Predict linear regression
predict_linear(node_disk_free_bytes[1h], 3600) < 0

# Recording rule (pre-computed)
- record: job:http_requests:rate5m
  expr: rate(http_requests_total[5m])
Serviceerkennung und -ziele
# prometheus.yml
scrape_configs:
  - job_name: 'kubernetes-nodes'
    kubernetes_sd_configs:
      - role: node
    relabel_configs:
      - source_labels: [__meta_kubernetes_node_label_kubernetes_io_role]
        regex: control-plane
        action: drop

  - job_name: 'custom-app'
    static_configs:
      - targets: ['app01:8080', 'app02:8080', 'app03:8080']
TimescaleDB: PostgreSQL für Zeitreihen
TimescaleDB ist eine Erweiterung von PostgreSQL, die Zeitreihenfunktionen hinzufügt und gleichzeitig die volle SQL-Kompatibilität beibehält.
Hypertische
-- Create a hypertable (automatically partitions by time)
CREATE TABLE temperature (
    time TIMESTAMPTZ NOT NULL,
    sensor_id INTEGER,
    location TEXT,
    value DOUBLE PRECISION,
    humidity DOUBLE PRECISION
);

-- Convert to hypertable (partitions by 1 day chunks)
SELECT create_hypertable('temperature', 'time',
    chunk_time_interval => INTERVAL '1 day');

-- Add partitioning by location (optional, for multi-node)
SELECT add_dimension('temperature', 'location', number_partitions => 4);
Komprimierung
-- Enable compression on hypertable
ALTER TABLE temperature SET (
    timescaledb.compress,
    timescaledb.compress_segmentby = 'sensor_id',
    timescaledb.compress_orderby = 'time DESC'
);

-- Compression policy: compress data older than 7 days
SELECT add_compression_policy('temperature', INTERVAL '7 days');

-- Compression ratio: 90-97%
-- 100GB of raw data → 3-10GB compressed
Kontinuierliche Aggregate (materialisierte Ansichten)
-- Create 5-minute aggregates (refreshed every minute)
CREATE MATERIALIZED VIEW temperature_hourly
WITH (timescaledb.continuous) AS
SELECT time_bucket('5 minutes', time) as bucket,
       sensor_id,
       AVG(value) as avg_temp,
       MAX(value) as max_temp,
       MIN(value) as min_temp,
       stddev(value) as temp_stddev
FROM temperature
GROUP BY bucket, sensor_id;

-- Refresh policy
SELECT add_continuous_aggregate_policy('temperature_hourly',
    start_offset => INTERVAL '3 days',
    end_offset => INTERVAL '1 hour',
    schedule_interval => INTERVAL '1 minute');
Datenaufbewahrung
-- Automatic data removal
SELECT add_retention_policy('temperature_raw', INTERVAL '30 days');
SELECT add_retention_policy('temperature_hourly', INTERVAL '1 year');
SELECT add_retention_policy('temperature_daily', INTERVAL '5 years');
Abfragemuster
Downsampling
-- Raw data: 1m intervals, kept 30 days
-- 5m average: kept 1 year
-- 1h average: kept 5 years

SELECT time_bucket('1 hour', time) as hour,
       AVG(value) as avg_temperature,
       PERCENTILE_CONT(0.95) WITHIN GROUP (ORDER BY value) as p95
FROM temperature
WHERE time >= NOW() - INTERVAL '7 days'
GROUP BY hour
ORDER BY hour;
Interpolation (Lücken füllen)
-- Fill missing data with linear interpolation
SELECT time_bucket('5 minutes', time) as bucket,
       INTERPOLATE(AVG(value)) as temperature
FROM temperature
WHERE sensor_id = 1
  AND time >= NOW() - INTERVAL '1 hour'
GROUP BY bucket
ORDER BY bucket;

-- Or use LAST observation carried forward (LOCF)
SELECT time_bucket('5 minutes', time) as bucket,
       LOCF(AVG(value)) as temperature
FROM temperature
GROUP BY bucket
ORDER BY bucket;
Anomalieerkennung
-- Detect values outside 3 standard deviations
WITH stats AS (
    SELECT AVG(value) as mean,
           stddev(value) as sigma
    FROM temperature
    WHERE time >= NOW() - INTERVAL '24 hours'
)
SELECT time, value,
       (value - mean) / sigma as z_score
FROM temperature, stats
WHERE time >= NOW() - INTERVAL '1 hour'
  AND ABS((value - mean) / sigma) > 3
ORDER BY time;
Speicherung und Komprimierung
Wie TSDBs eine hohe Komprimierung erreichen
Raw data layout (row-oriented):
time, sensor_id, location, value
14:30:00, 1, "room_a", 23.5
14:30:01, 1, "room_a", 23.6
14:30:02, 1, "room_a", 23.4
14:30:03, 1, "room_a", 23.7

Column-oriented + Delta encoding:
time:    14:30:00, +1s, +1s, +1s  → 1 value + 3 deltas
sensor_id: 1, 1, 1, 1 → run-length encoding: "1 × 4"
location: "room_a" × 4 → run-length encoding: "room_a × 4"
value: 23.5, +0.1, -0.2, +0.3 → delta encoding

Result: ~95% compression vs. raw text
Komprimierungsverhältnisse
| Datenbank | Roh | Komprimiert | Verhältnis |
|---|---|---|---|
| TimescaleDB | 100 GB | 3-10 GB | 90-97 % |
| InfluxDB | 100 GB | 5-15 GB | 85-95 % |
| Prometheus | 100 GB | 20-25 GB | 75-80 % |
| VictoriaMetrics | 100 GB | 3-8 GB | 92–97 % |
Anwendungsfälle
1. Infrastrukturüberwachung
# Node exporter metrics collected every 15 seconds
metrics:
  - cpu_usage{host="web01", cpu="0"}
  - memory_used{host="web01", type="RAM"}
  - disk_io{host="web01", device="sda", type="read_bytes"}
  - network_bytes{host="web01", interface="eth0", direction="in"}
  - load_average{host="web01", duration="1m"}

storage:
  raw: 15s intervals, 7 days
  aggregated: 5m intervals, 30 days
  daily: 1h intervals, 1 year
2. IoT-Sensordaten
# Millions of devices sending data every minute
from timescaledb import hypertable

sensors = hypertable('sensor_data', 'time',
    chunk_time='1 day',
    compression='7 days',
    retention='90 days'
)

# Query: average temperature per device per hour
query = """
    SELECT time_bucket('1 hour', time) as hour,
           device_id,
           AVG(temperature) as avg_temp,
           COUNT(*) as samples
    FROM sensor_data
    WHERE time >= NOW() - INTERVAL '24 hours'
    GROUP BY hour, device_id
"""
3. Finanzielle Tick-Daten
-- Stock price ticks: 10M+ per day per instrument
CREATE TABLE ticks (
    time TIMESTAMPTZ NOT NULL,
    symbol TEXT NOT NULL,
    price DOUBLE PRECISION,
    volume BIGINT,
    bid DOUBLE PRECISION,
    ask DOUBLE PRECISION
);

SELECT create_hypertable('ticks', 'time',
    chunk_time_interval => INTERVAL '1 hour');

-- OHLC (Open-High-Low-Close) candlestick query
SELECT time_bucket('5 minutes', time) as bucket,
       symbol,
       FIRST(price, time) as open,
       MAX(price) as high,
       MIN(price) as low,
       LAST(price, time) as close,
       SUM(volume) as volume
FROM ticks
WHERE symbol = 'AAPL'
  AND time >= NOW() - INTERVAL '1 day'
GROUP BY bucket, symbol;
Best Practices
Schema-Design
-- Good schema: separate metrics by table
CREATE TABLE cpu_usage (time TIMESTAMPTZ, host TEXT, value DOUBLE PRECISION);
CREATE TABLE memory_usage (time TIMESTAMPTZ, host TEXT, value DOUBLE PRECISION);

-- Avoid: single wide table with all metrics as columns
-- (leads to sparse data, poor compression)
Optimierung der Chunk-Größe
-- Too small: too many partitions, slow queries
-- Too large: poor memory management, slow ingestion
-- Rule of thumb: each chunk should be 1-10GB compressed

-- For 1000 writes/sec, 1KB each = 86GB/day
-- 1 day chunks = 86GB (too large)
-- 6 hour chunks = 21GB (good)
SELECT set_chunk_time_interval('temperature', INTERVAL '6 hours');
Fazit
Zeitreihendatenbanken wurden speziell für die Daten entwickelt, die moderne Systeme am häufigsten produzieren: zeitgestempelte Messungen aus Anwendungen, Infrastruktur, IoT-Geräten und Finanzmärkten.
| Anwendungsfall | Empfohlene Datenbank |
|---|---|
| Infrastrukturüberwachung (Kubernetes) | Prometheus + VictoriaMetrics |
| IoT-Sensordaten mit SQL-Abfragen | TimescaleDB |
| Echtzeitanalysen, DevOps | InfluxDB |
| Hochfrequente Finanzdaten | QuestDB |
| Cloud-native, Pull-basierte Metriken | Prometheus |
Wichtige Erkenntnisse:
- TSDBs sind schreiboptimiert – verarbeiten mehr als 1 Million Datenpunkte pro Sekunde auf einem einzelnen Knoten.
- Hohe Komprimierung (90 %+) – mehr Daten zu geringeren Kosten speichern.
- Automatischer Datenlebenszyklus – Aufbewahrungsrichtlinien und Downsampling reduzieren die Speicherkosten.
- SQL-Unterstützung, wo möglich – TimescaleDB bietet vollständige SQL-Kompatibilität.
- Verschiedene Tools für unterschiedliche Anforderungen – Prometheus für Cloud-native, InfluxDB für DevOps, TimescaleDB für SQL-Power-User.
Die richtige Zeitreihenarchitektur erfasst Daten effizient, altert sie ordnungsgemäß und fragt sie sofort ab – so werden rohe, mit Zeitstempel versehene Zahlen in umsetzbare Erkenntnisse umgewandelt.
Kommentare
0 KommentareNoch keine freigegebenen Kommentare sichtbar. Neue Antworten können moderiert werden.